
Open a form from Forms (opens in a new tab) and select Summary. It groups completed answers in the order of your published form, keeping the questions and introductory text beside the results. Use Responses for individual submissions and Insights for visits, sources and respondent journeys.
Choose which answers to compare
The date control starts at 30 days. Choose another period or All time to include older completed responses. Summary counts by submission date in your browser’s time zone. Partial submissions are left out. The selected dates stay with you when switching to Responses or Insights.
The heading shows how many completed responses are in the period. Where a comparison is available, the change uses the equivalent period immediately before it. A comparison that includes today is still changing.
Check each question’s answered count before comparing results. Most chart percentages use the people who answered that question.
Good to know
- Skipping an optional question does not create a zero score.
- Multiple-selection percentages can exceed 100% because people can choose several options.
- File-type percentages use uploaded files; matrix percentages use selections in each row.
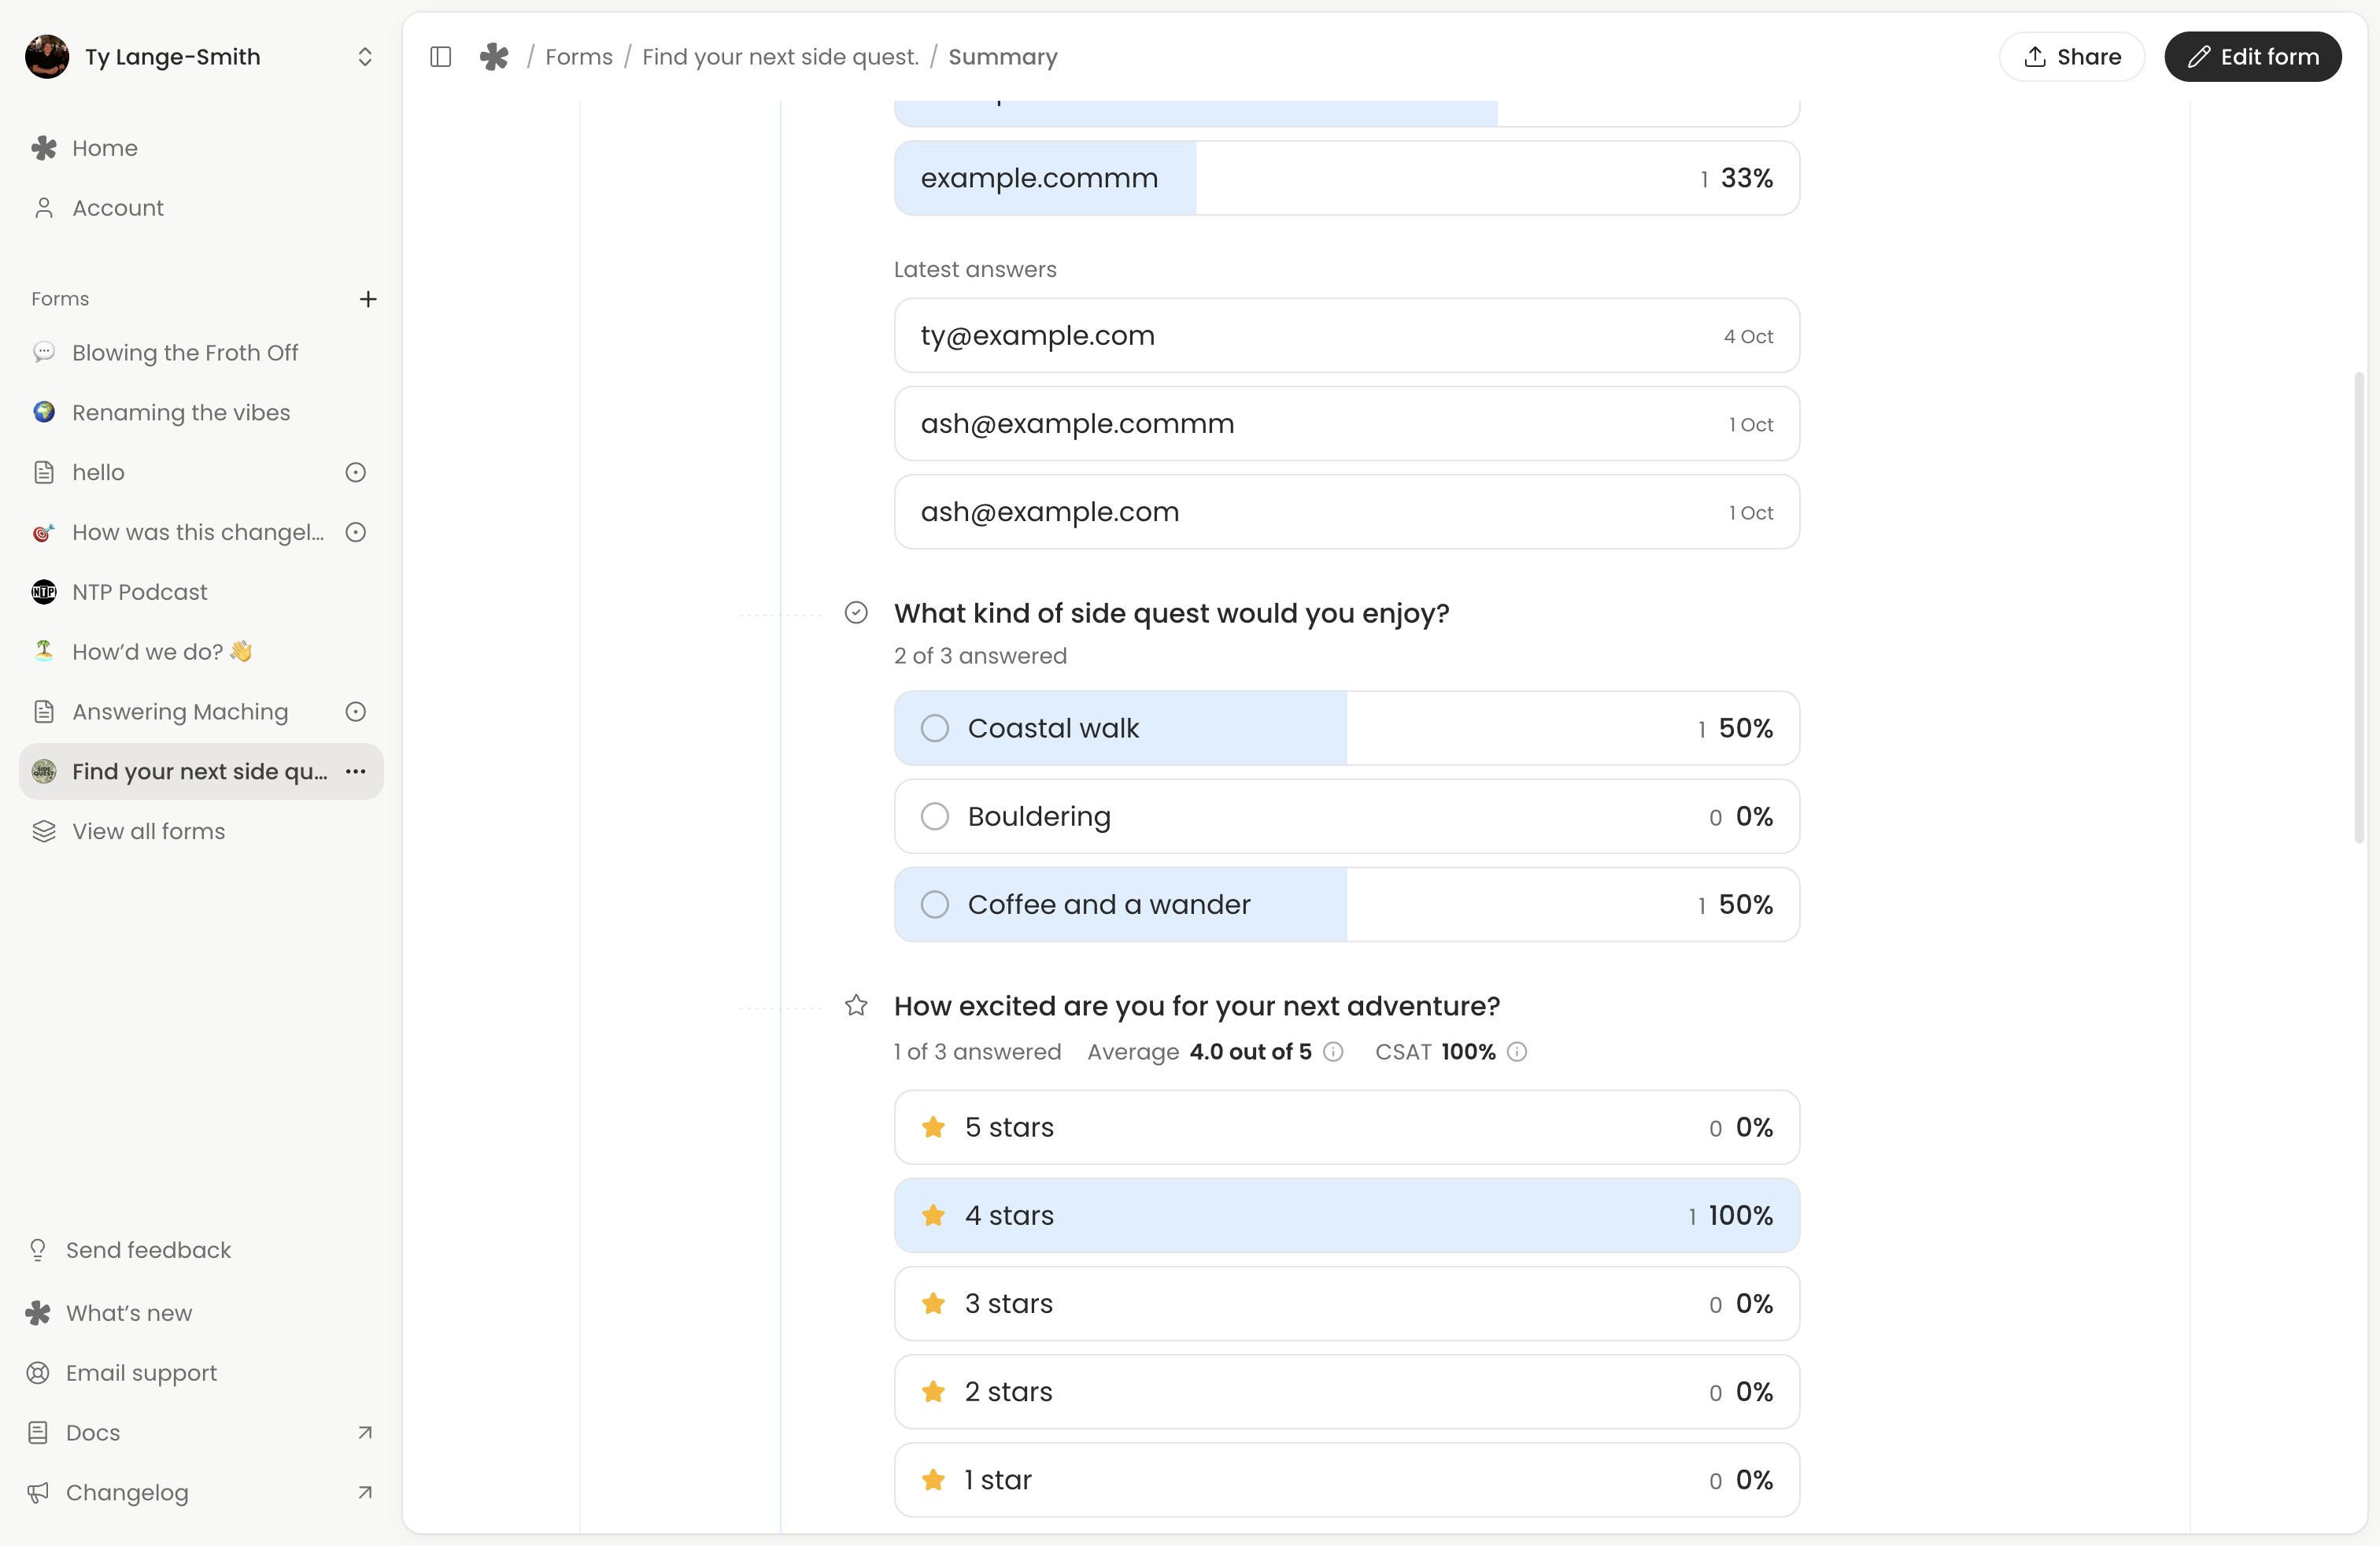
Read results beside the questions
Answer | What the summary shows |
|---|---|
| Choices | Counts and percentages for each option. |
| Ratings and scales | Score distribution and an average, with additional measures for supported scales. |
| Numbers | A distribution with the median and range. |
| Dates and times | Groups showing when people chose. A time has no time zone attached to its answer. |
| Ranking | Average position for each option; a lower position means it was ranked nearer first. |
| Matrix | The answers for each row of the grid. |
| Written answers | Recent answers, with a control to expand the list. Email and link questions can also group by domain or site. |
| Voice and files | Recording or typed-answer counts and file summaries. Open Responses for the full submission and media. |
Read signatures individually in Responses, rather than as a summary chart. Summary follows the current published question order; Responses also keeps questions that have since been removed.
Select a written answer to open its response. Expand the latest three answers to read up to 10 recent answers, or choose View completed responses for submissions within the selected dates.
Correct answers in Responses, where an Edited marker keeps the original value available.
Filter answers together
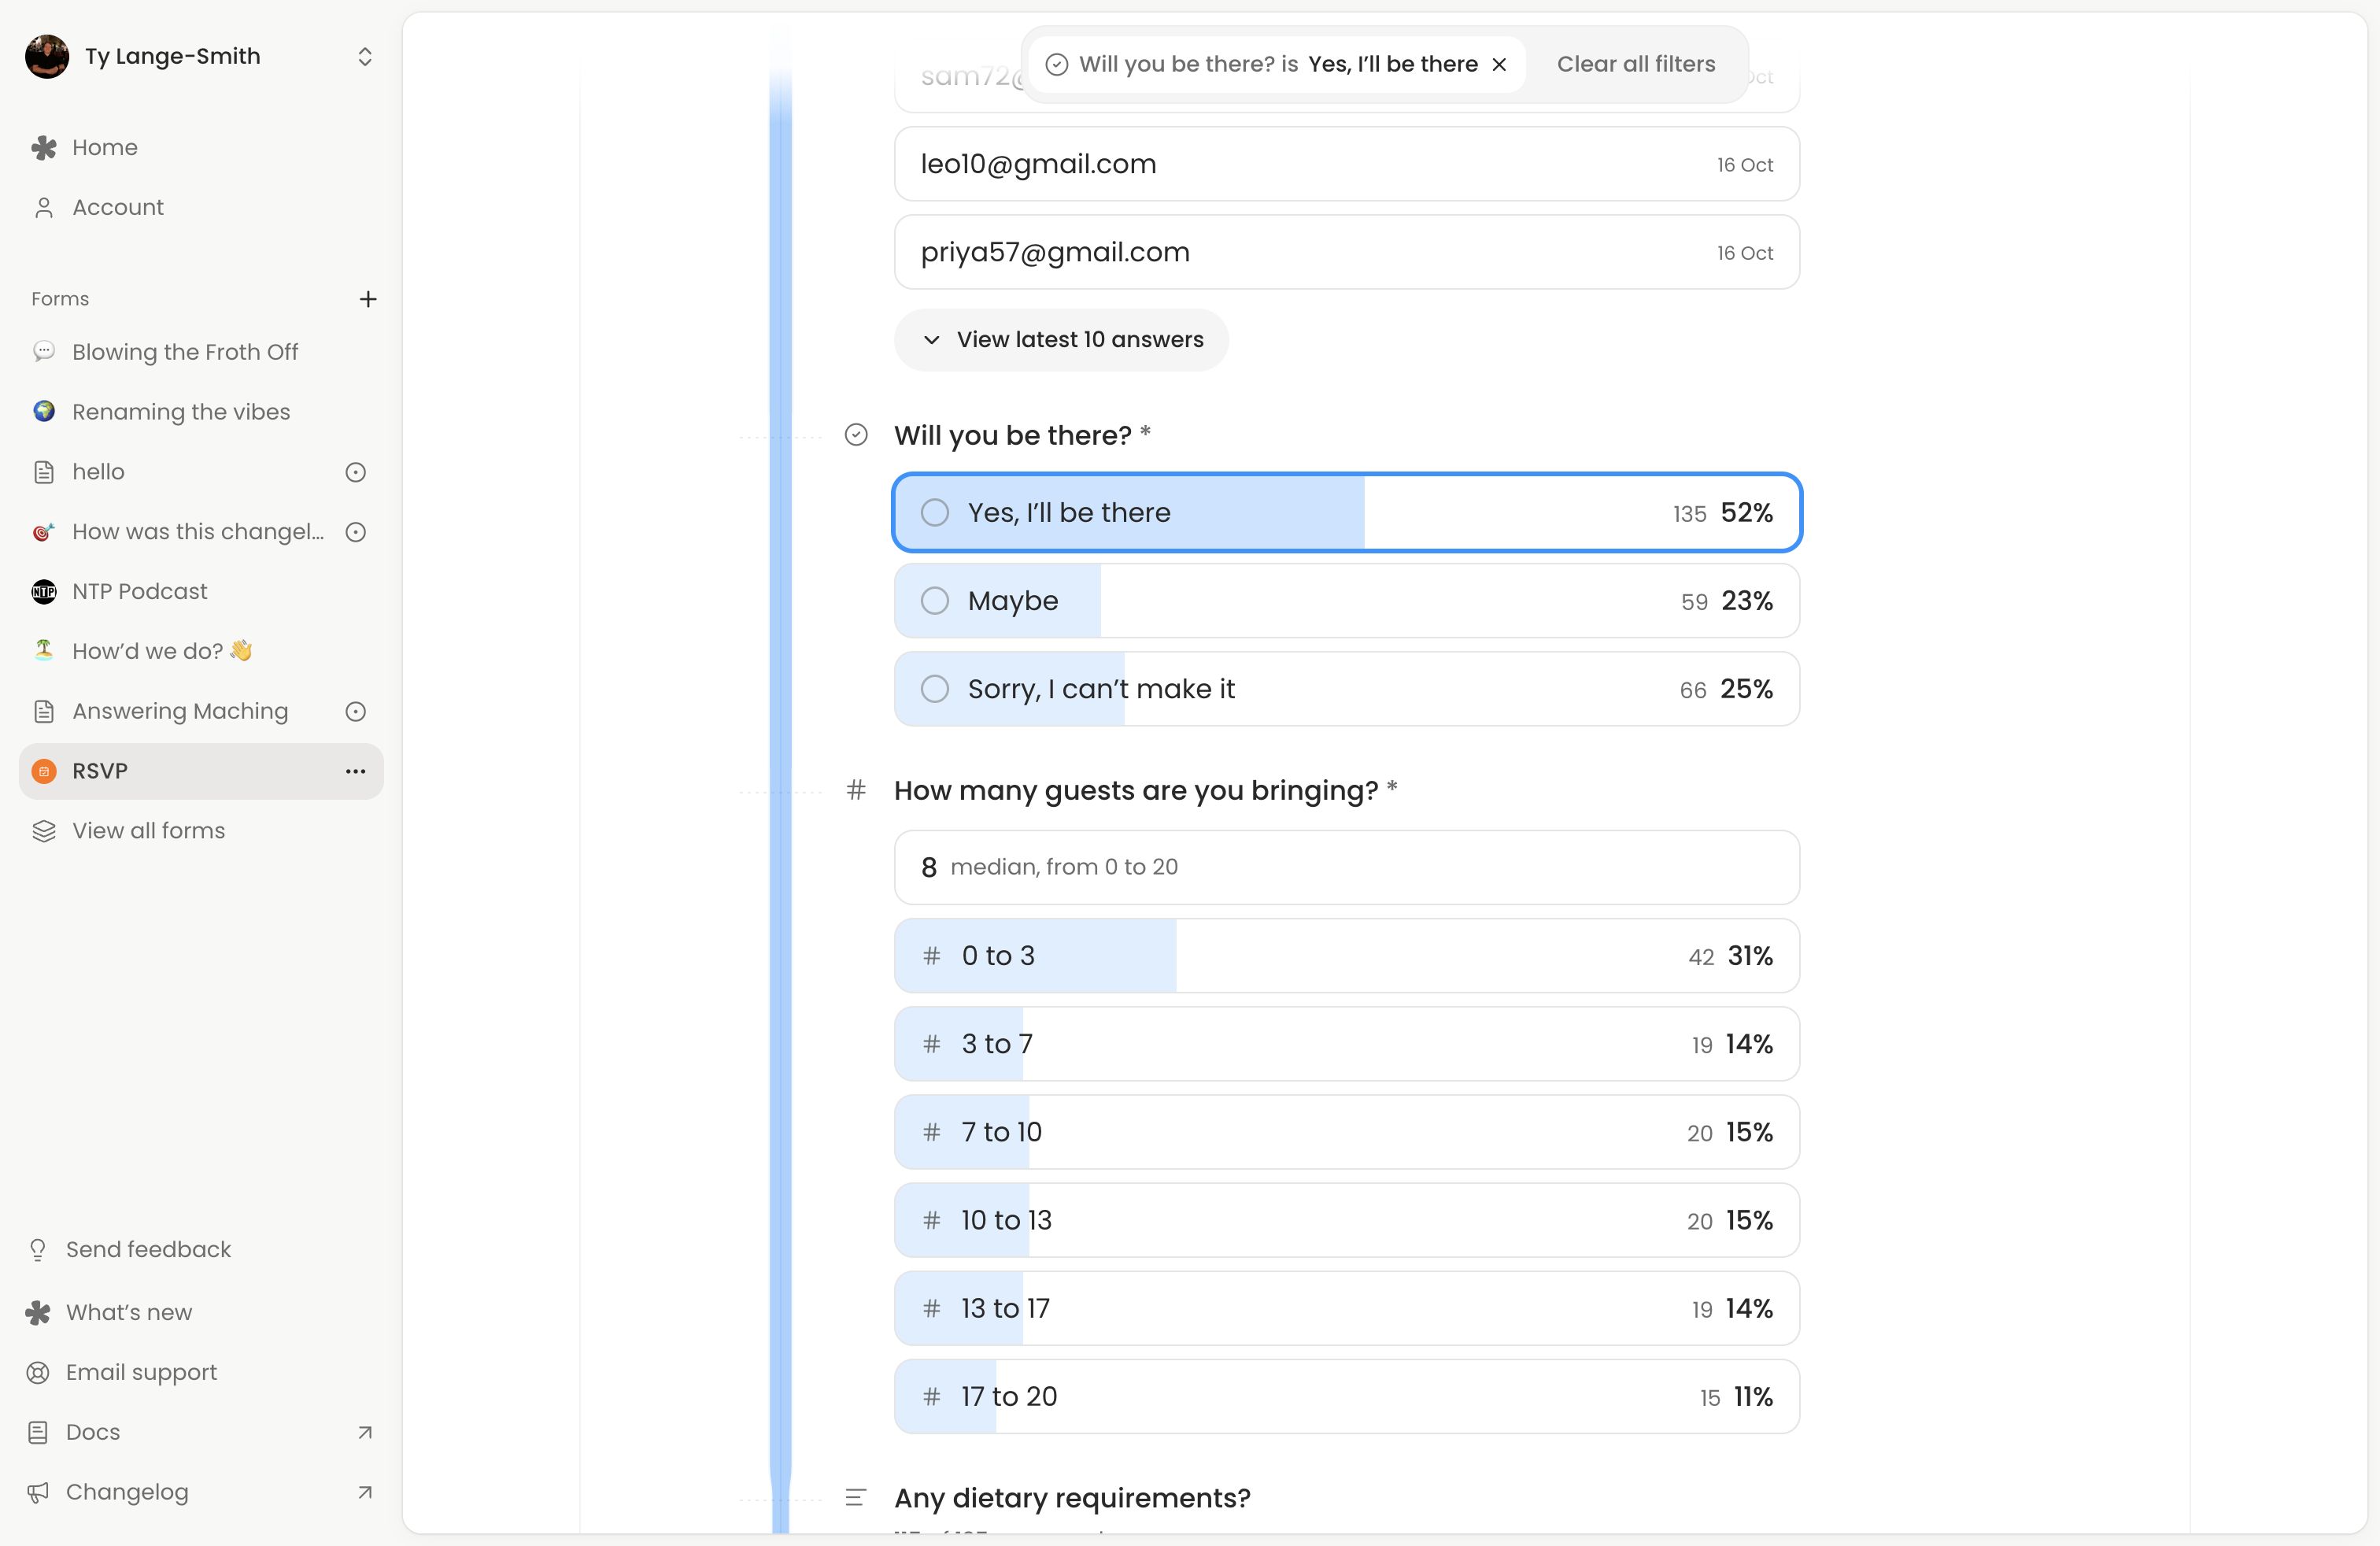
Select an option or a group in a chart to narrow the other question summaries to people who gave that answer. For example, select a low rating, then read what those people wrote. You can combine filters from different questions; they must all match.
The question you filtered keeps its other options available so you can switch the selection. Select the same result again, remove its chip or choose Clear all filters to widen the results.
Question filters help explore Summary. They do not become filters on the Responses table. A link to an individual answer still opens that person’s response.
Review AI results
AI column summaries appear after the form’s questions and follow the same dates and answer filters. Counts include states such as Unsure or queued results; those states describe coverage, rather than a new answer category.
Select an AI result to filter other summaries. When it is the only active filter, the filter bar offers View responses with that AI result applied. Clear its filter chip in Responses to return to the wider list. AI columns explains sources, processing and manual corrections.
Compare answers with the funnel
On Creator, select Funnel to show progress beside completed answers. Answer filters narrow the answer charts while the funnel keeps all tracked activity for the period. See Insights for counting rules.
Select See the people who stopped here on a page to investigate its journeys in Insights.
Explore an empty form
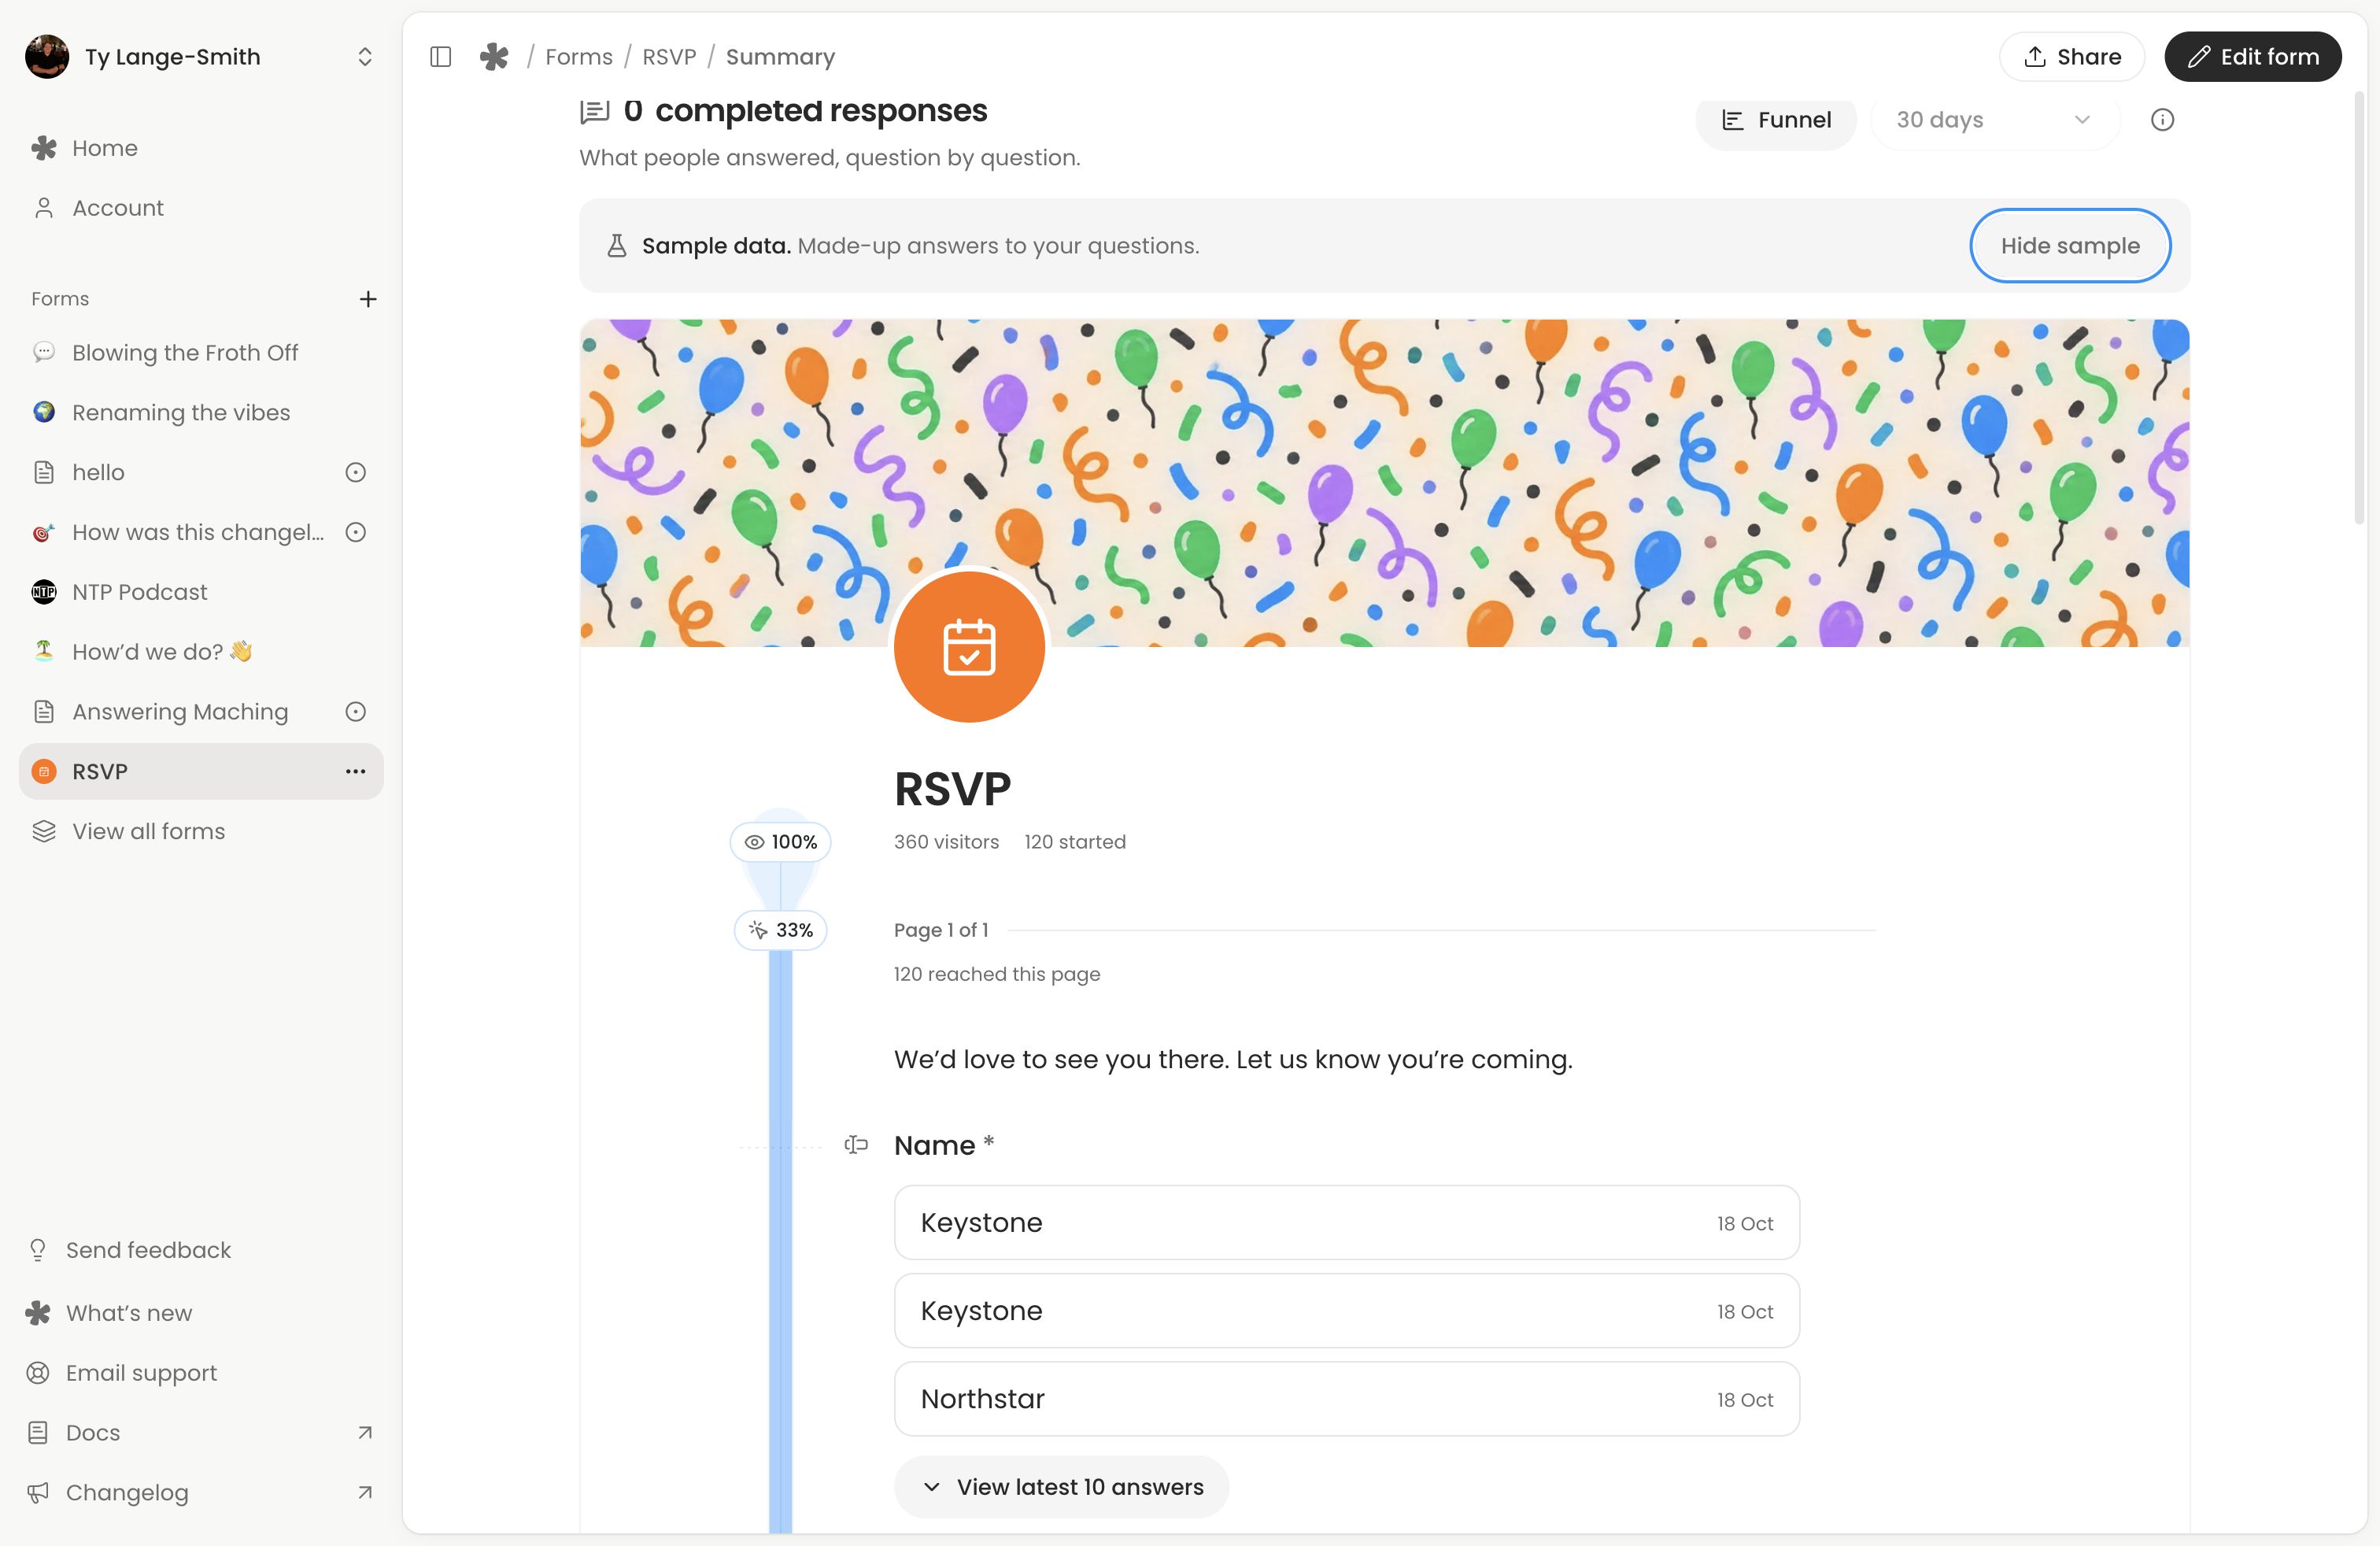
Select Show sample data on a form with questions but no completed responses to explore made-up answers. Choose Hide sample to return to your results.
The preview can include a made-up funnel too. Its visitor, start and submission counts are examples, separate from your real activity, and it has no links to real respondents. On Free, the Funnel control also offers Show sample data so you can explore Creator’s funnel beside answers.
If responses exist outside the selected period, choose View all time instead. Share the live form to collect real answers.
The Sample data notice identifies made-up results; the heading still shows your real response count. Dates cannot change while the sample is open. Hiding it clears sample answer filters.
Next action: Choose a reporting period, inspect one answer group, then open a real response for context.