
Open a form from Forms (opens in a new tab) and select Insights. Free includes form stats and AI result summaries. Creator adds the funnel, respondent journeys, and traffic and device breakdowns you can filter by. On Free, select Show sample data on any of them to see how it reads with made-up numbers; the funnel uses your own form’s pages and questions. Read actual responses alongside the numbers, especially when your sample is small.
Read visits and responses together
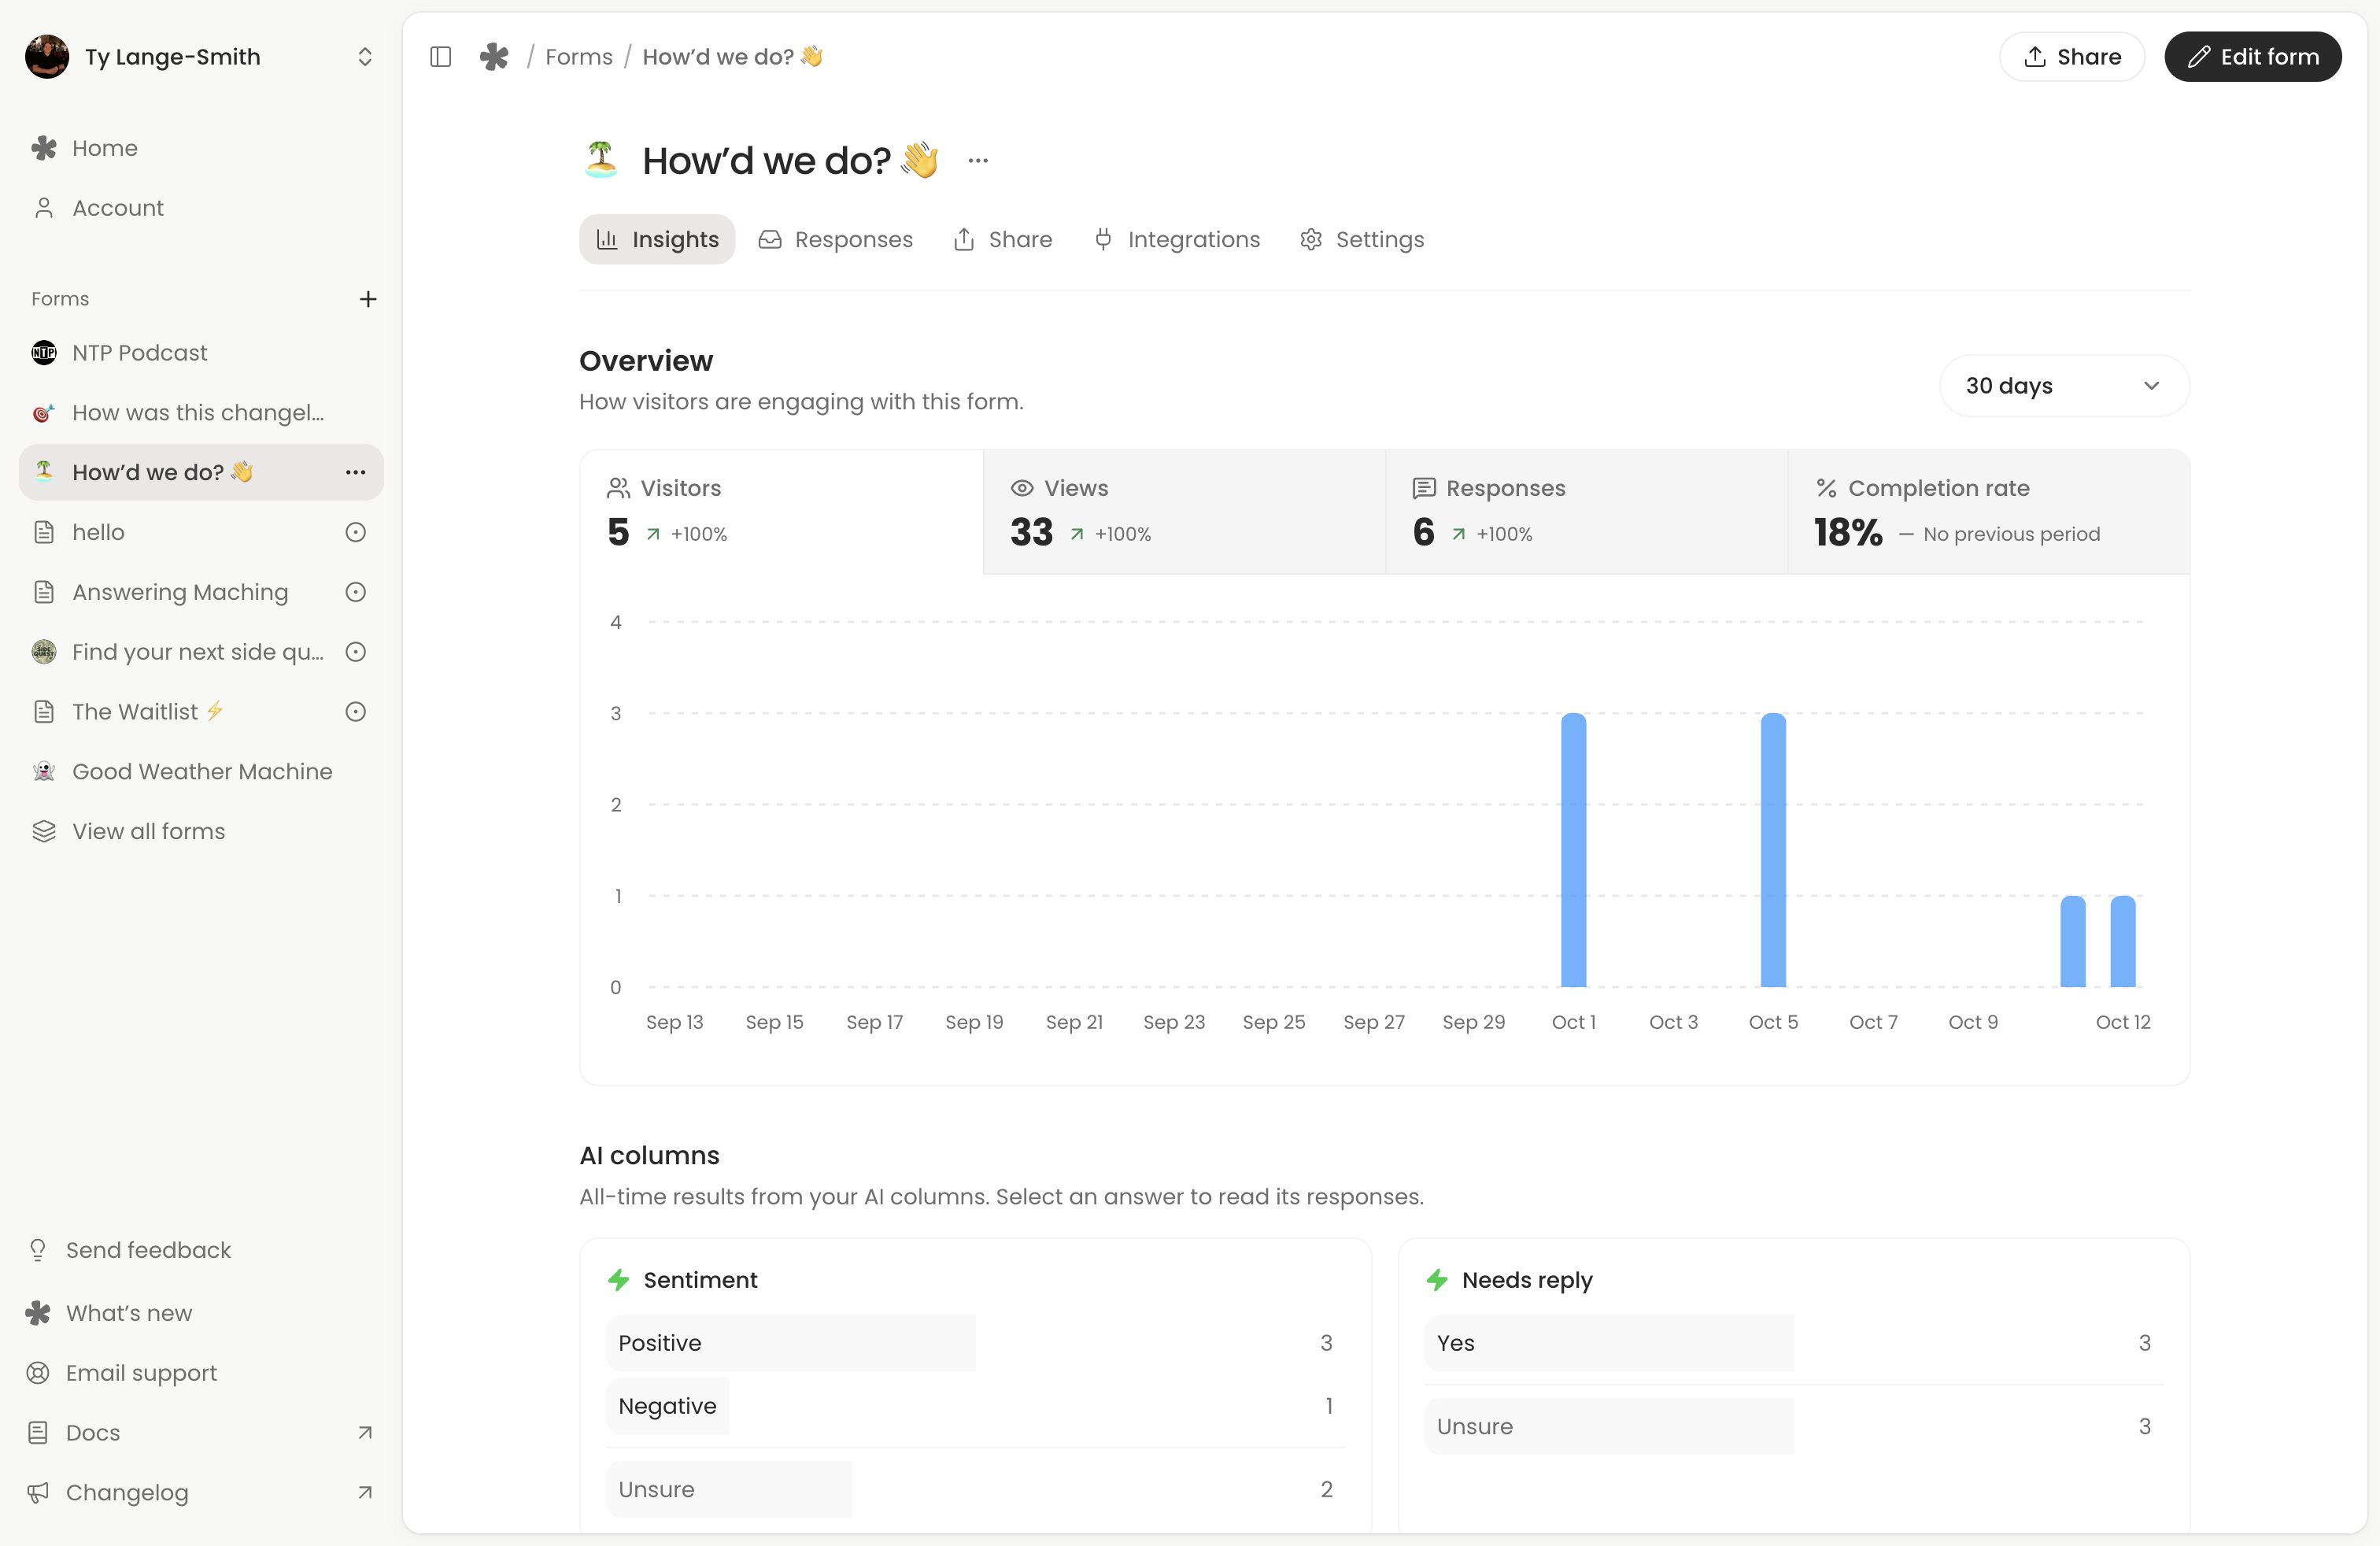
The Overview has five metrics. Select a metric to change the activity chart:
Metric | Meaning |
|---|---|
| Visitors | Different visitors who opened the form; returning visitors count once within the reporting period. |
| Views | How many times the form was opened. One visitor can create multiple views. |
| Starts | People who answered a question or turned a page. Opening the form alone is not starting. |
| Responses | Completed submissions during the reporting period. Partial submissions are not completed responses. |
| Completion rate | Responses divided by starts: how many of the people who began answering sent the form. |
A view does not mean someone started answering, so completion is measured against starts. Compare Starts with Views to see how many people who open your form begin it.
Bots and link previews are left out of views and visitors. Your own visits while you are signed in are not recorded either, so checking your live form does not add views or starts. A response you send yourself still counts as a response. Use a private window to test it as a respondent would.
See where people stop
On Creator, the Funnel shows how far people get: everyone who opened the form, everyone who started answering, each later page, and everyone who sent it. The band narrows with each step, and the label between two steps shows the share lost there. The corner shows the share of visitors who sent the form. Point at a step to see its count, its share of the step before and of visitors, and how many people stopped there. Point at a question to see how many got that far and how many were lost there. Each page is split into a slice per question, marked with its question type. A slice counts the people who got at least that far: they answered it, a later question on the page, or moved past the page. Where the band drops within a page is the question people left on.
Someone still answering is counted once they send the form or have been idle for 30 minutes. Progress records keep which pages and questions were reached, answered or changed, and when, plus where the person came from and on what device. They never store answers, and they work whether or not you collect partial submissions. After you publish changes, earlier visits count against the pages and questions that are still in the form. Counting began when the funnel was added, so earlier visits are not included. Responses sent before then still count as starts in the Overview, so completion never looks higher than it was.
Follow each person
On Creator, Journeys lists everyone who started your form, newest first, once they have sent it or been idle for 30 minutes. Completed means they sent it. Partial means they stopped partway, even if your form doesn’t keep partial submissions. Each row shows who they are (their name or email if your form asks for it), where they were and on what device, where they came from, how much they answered, how long it took and when they were last active. A dot for each page is blue for reached, orange for where they stopped and hollow for pages they never reached. Search answers, places, devices and sources from the box beside the heading. Only the latest 1,000 journeys in a period are shown, so narrow the dates to see older ones.
Select a row to see the whole journey: the site they found your form on and any campaign tag, when they opened it, each page and question in order with its time and the answer they gave when one was kept, and when they sent it or where they stopped. If they changed an answer, you see when, with the answer they ended with on that step, and a gap of more than 30 minutes shows as Came back after. Time is the time spent answering, without the time away. A journey shows answers only from the response or partial submission it belongs to. A completed journey links to its response. On Creator, each response also shows its journey under Journey, unless it was sent before journeys were recorded or by you while signed in.
Visits from before journeys were recorded show their steps without times.
Filter by a source
On Creator, each row under Traffic shows how many views came from that source and, in a darker band, how many of them sent the form. Point at a row to see its responses and conversion rate. Select a row to filter the whole page by it: the Overview, funnel, journeys and traffic then count only people from that source, browser, system or device. Select the row again, or the filter at the top, to remove it. Starts and journeys recorded before filters existed don’t match any filter.
Choose a reporting period
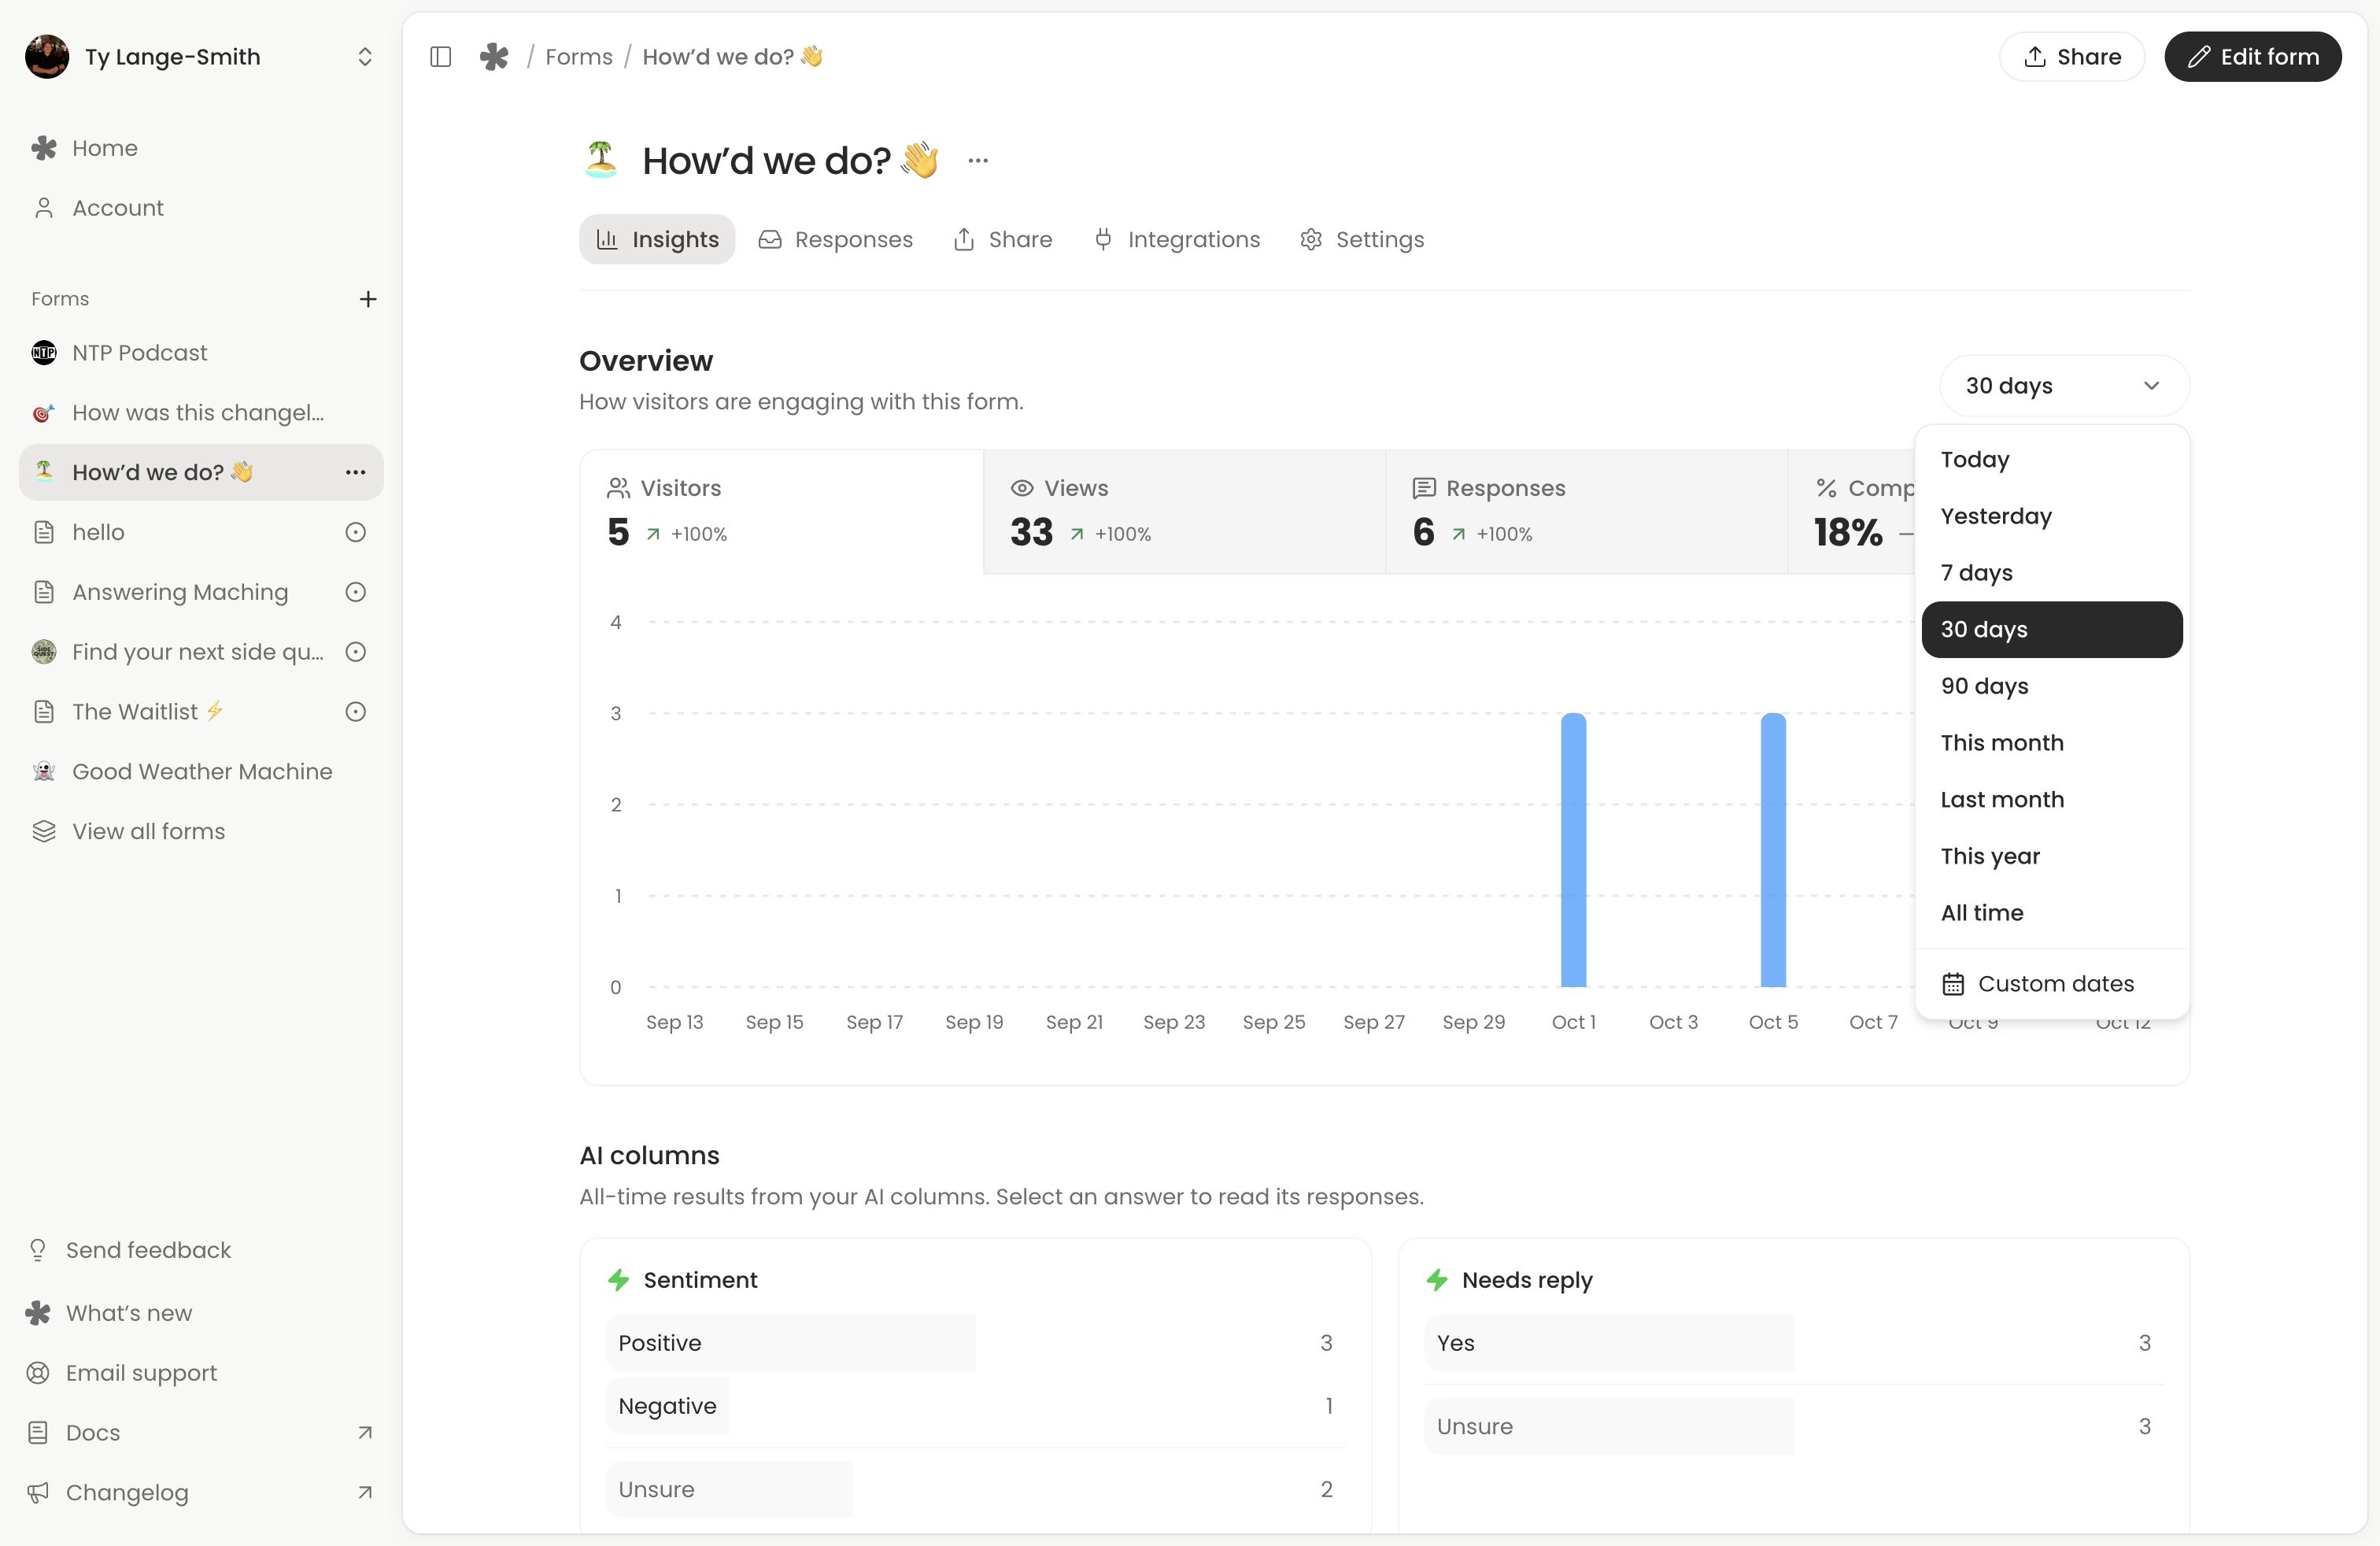
The date control starts at 30 days. Choose Today, Yesterday, 7 days, 30 days, 90 days, This month, Last month, This year, All time or Custom dates. Custom dates lets you choose a start and end date.
Calendar dates use your browser’s time zone. Where a comparison is available, the change beside a metric compares it with the preceding equivalent period. Keep the same form and comparable periods when assessing a change; a quiet week and a campaign launch are different contexts.
The Overview date selection applies to the Overview, funnel, journeys and traffic. Starts count in the period someone began answering or sent the form, and the funnel and journeys count people by when they started. AI columns use all-time completed responses, independently of that date selection.
Check where people came from
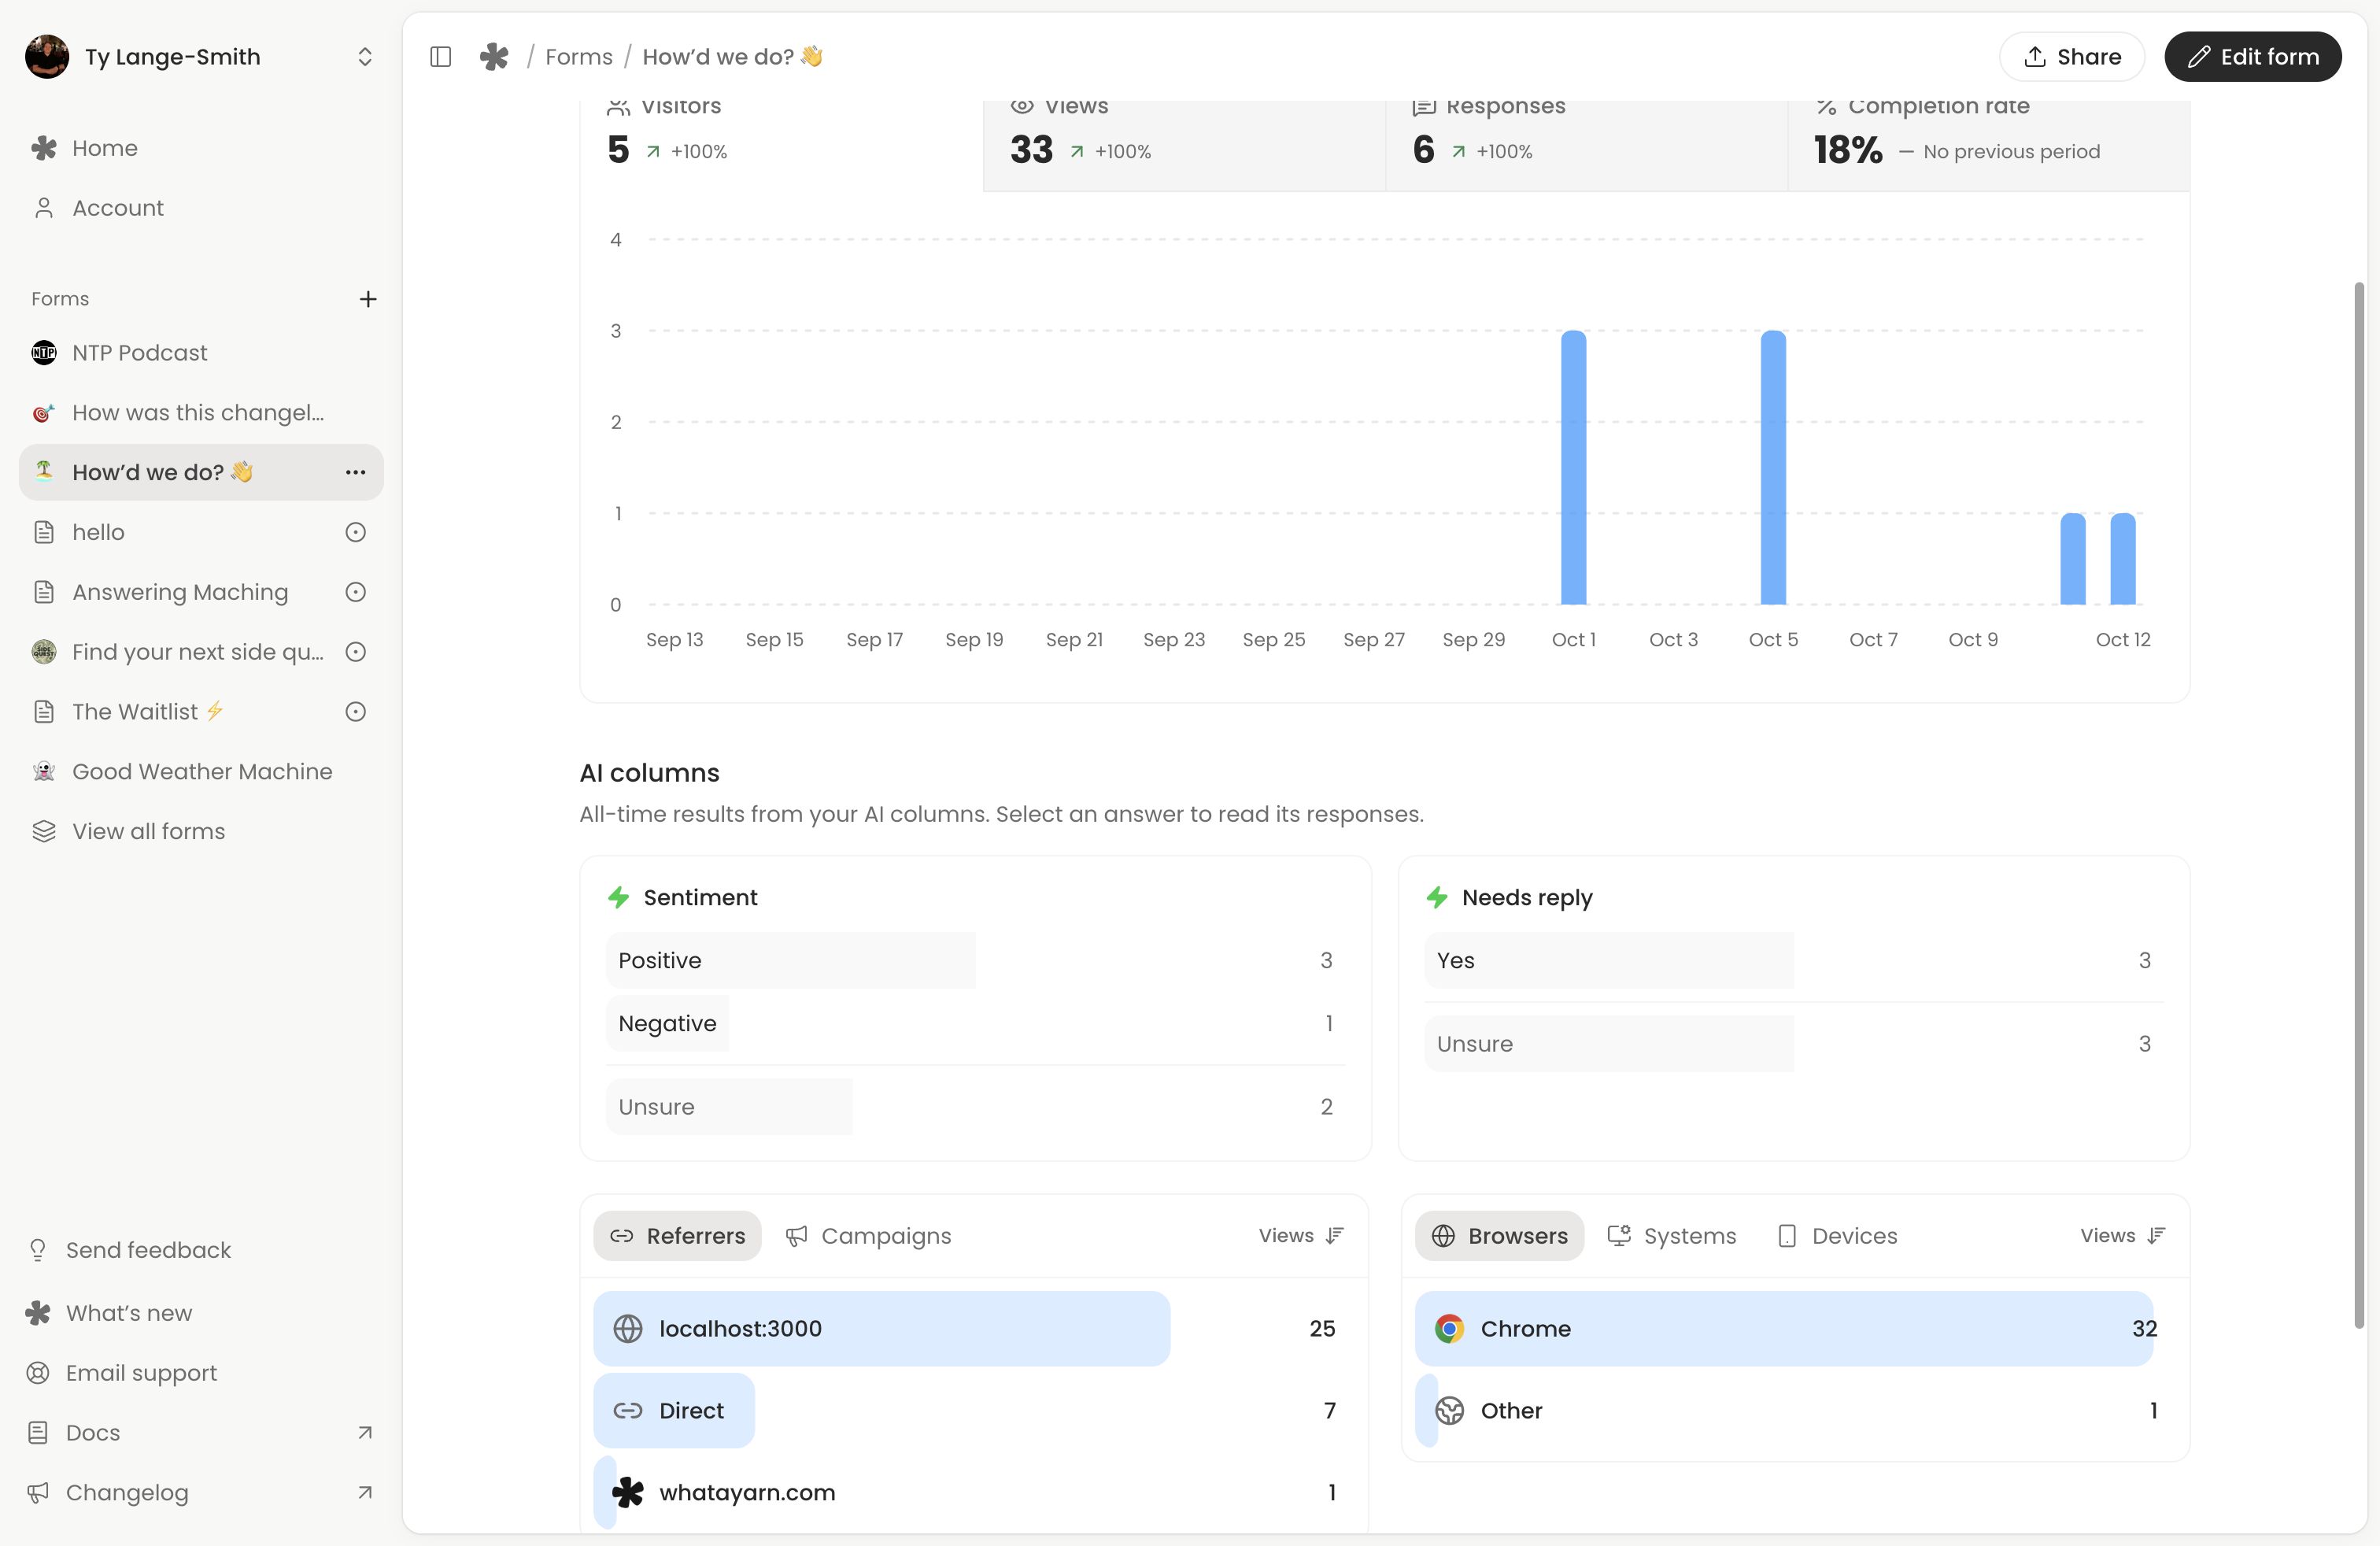
Creator’s traffic and device panels show available referring sites, campaign tags, browsers, operating systems and devices. Journeys also show each person’s approximate location. Available details depend on the browser and network information captured when someone visits. Missing referrers can appear as Direct; location is estimated from network information, not GPS or verified identity.
Use these breakdowns to decide where to share next or which devices to test. They do not identify a person or tell you why someone left without submitting.
Review AI columns
Insights summarises each column’s all-time completed-response results. Select an answer to open Responses filtered to that result. Clear the AI filter chip there to return to the wider list.
Spam, Sentiment, Urgency and Needs reply are included on Free. Creator supports custom questions, possible answers and rules. Existing Topic columns remain supported but are no longer in the new-column picker. See AI columns for setup and corrections.
The summary also includes states such as Unsure, queued or failed so you can see how much has been processed. A paused column can retain its previous answer in the table while its pending work appears as Queued in Insights. Read the pause explanation before comparing those counts.
AI does not listen to recordings or read uploaded files. A blank or unprocessed result is not evidence that the respondent had nothing to say.
Improve one part at a time
Try a clearer introduction, fewer required questions or a more specific prompt. Publish the change, allow time for new visits and compare equivalent reporting periods. Check several responses to understand the numbers. Recording questions can use the voice question guide to review their limits.
Existing Classic voice-message pages have a separate Insights screen. See Classic forms and messages if you are reviewing an older page.
Next action: Open a form’s Insights, choose a period and read a few responses behind its AI results.